Back to share page
You are currently viewing this lesson as a guest.
🟢 QA and MRIQC: Practice 3 (~20-minutes)
12
questions
left!
🟢 QA and MRIQC: Practice 3 (~20-minutes)
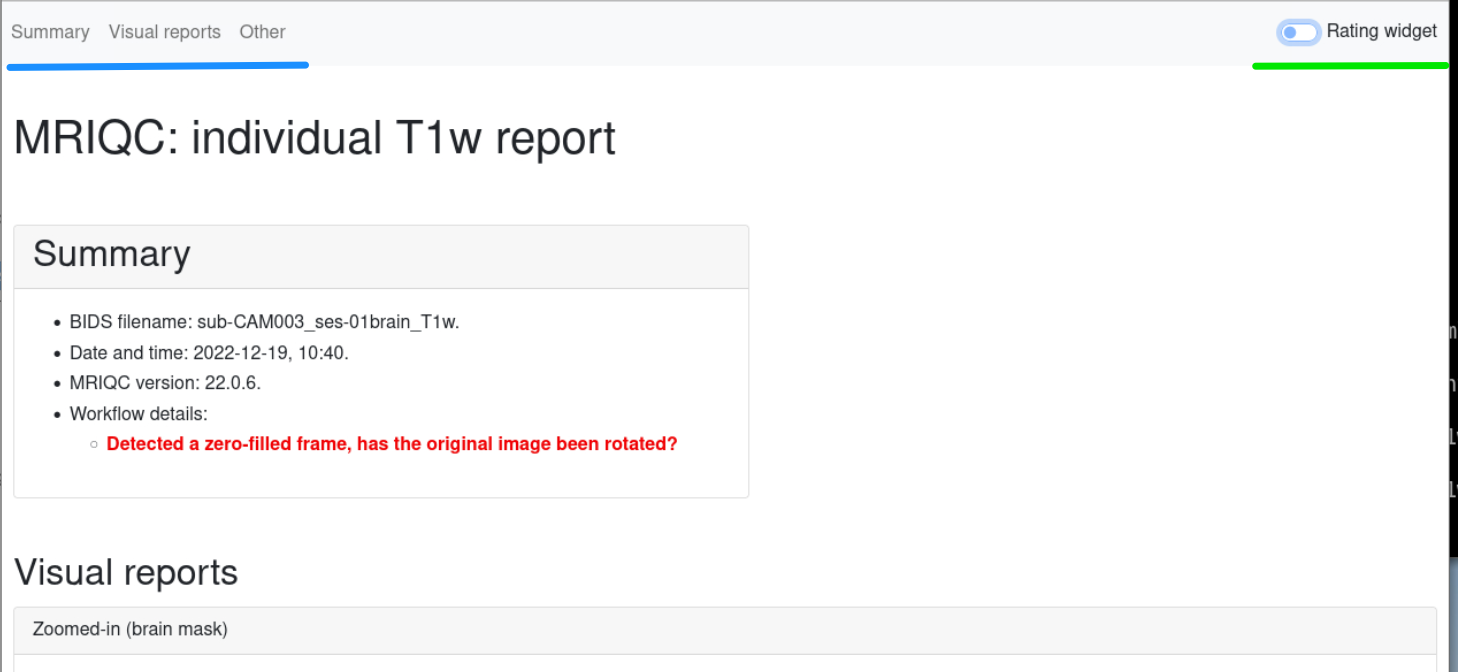
MRIQC individual report
By Dianne K Patterson at the University of Arizona
Was this helpful?
(Voting helps us personalize your learning experience!)
Did you like this lesson?
(Voting helps us personalize your learning experience!)
🟢 QA and MRIQC: Practice 2 (~10-minutes)
QA and QMTools (~20 minutes)